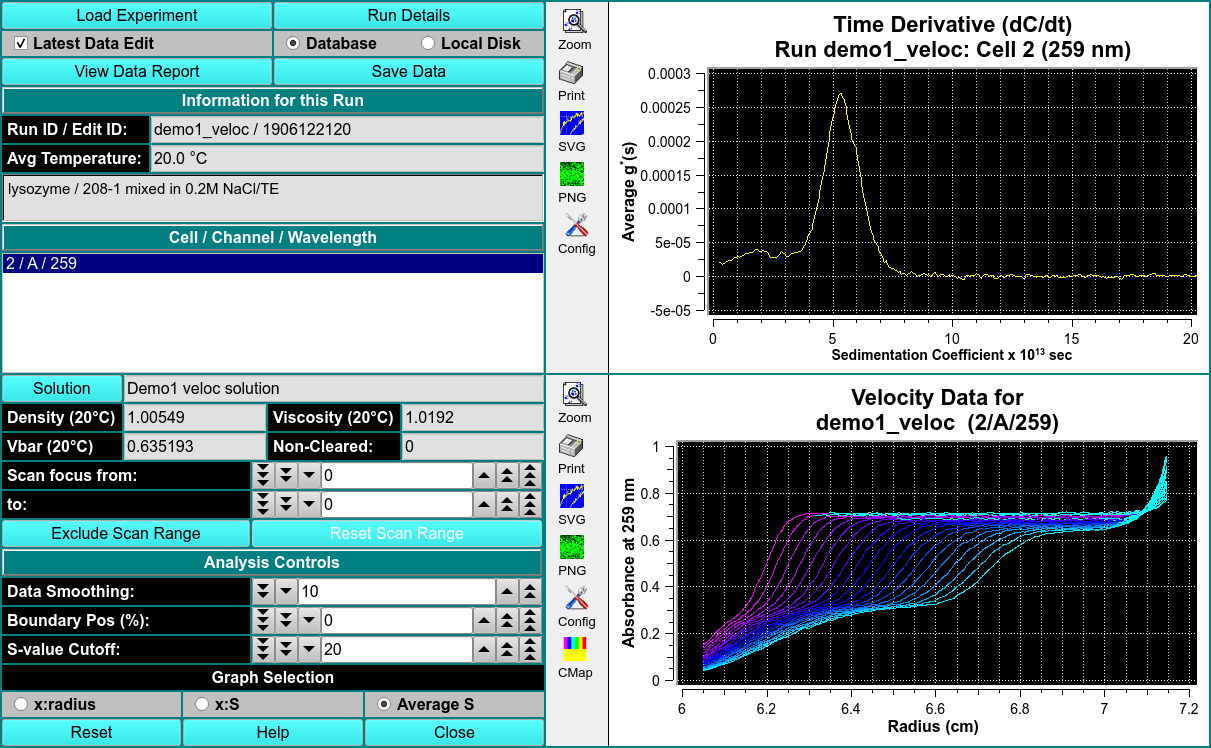
Time Derivative
This module will calculte g(S) differential sedimentation profiles by subtracting consectutive scan pairs from each other and mapping the resulting difference curves to the S domain to obtain dc/dt curves.
The advantage of this method is its ability to nicely subtract out time invariant noise. Unlike the van Holde-Weischet module, the Time Derivative method does not correct for diffusion. In order to obtain accurate results, it is important to use only a small scan range over which diffusion has not change significantly.
ANALYSIS CONTROLS
\(\textbf{Data Smoothing}\) Choose the number of points to use for any smoothing of raw input data.
\(\textbf{Boundary Pos. (%)}\) Choose the percent of the plateau-baseline range that is to be added to the baseline to form the beginning of analysis span.
\(\textbf{S-value Cutoff}\) Choose the sedimentation coefficient value to form the maximum X value of the Time Derivative plot.
GRAPH SELECTION
\(\textbf{x:radius}\) Select this radio button to choose a g*(S) versus radius dC/dt plot.
\(\textbf{x:S}\) Select this radio button to choose a g*(S) versus sedimentation coefficient dC/dt plot.
\(\textbf{Average S}\) Select this radio button to choose an Average g*(S) versus sedimentation coefficient dC/dt plot.