Enhanced Van Holde-Weischet
The method of Van Holde and Weischet (vHW) is a versitile, model-indepedent approach to determine sedimentation coefficient distributions by graphically analayzing sedimentation velocity experimental data.
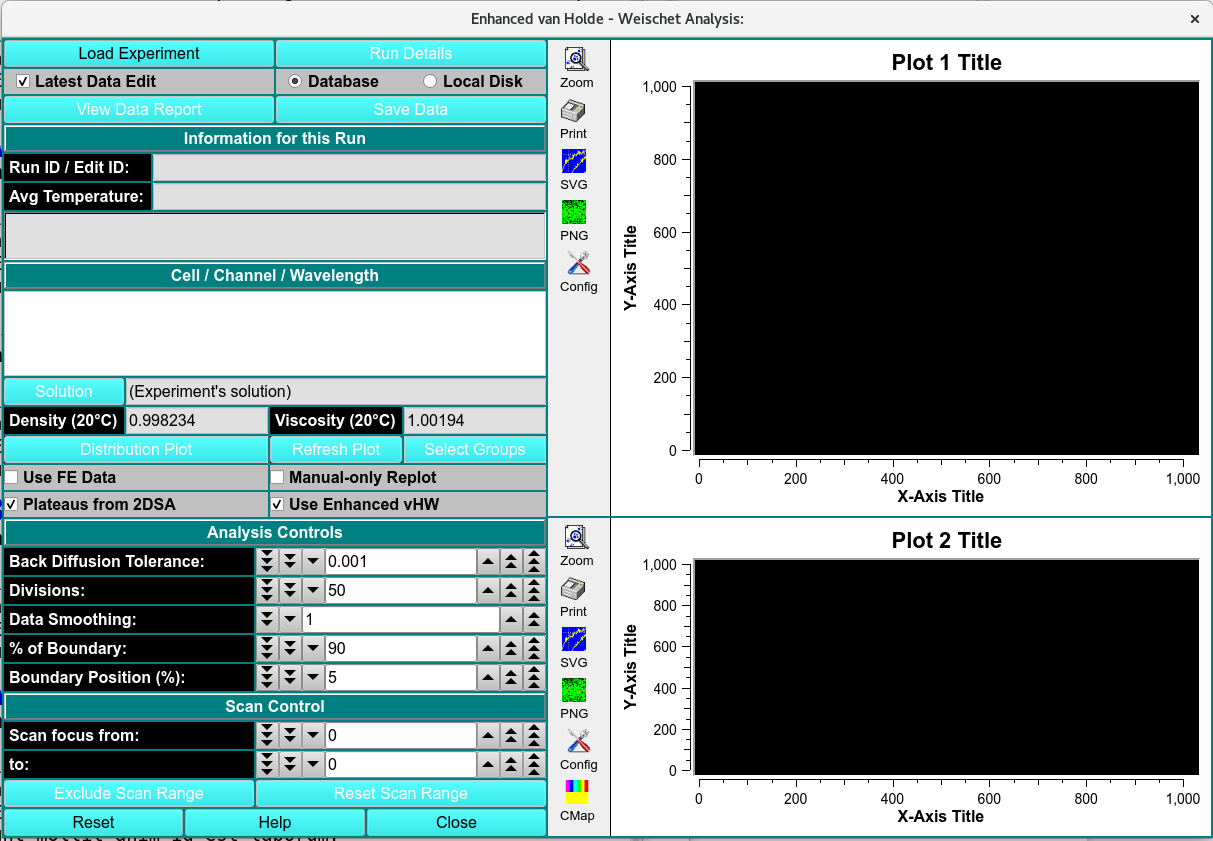
\(\textbf{Distribution Plot}\) Click here for a plot dialog that will show a vHW distribution plot illustrating sedimentation coefficeint power related to seperate species.
van Holde-Weischet Distribution/Histogram Plots
The following plots show the clusting of data around several sedimention coefficient points, indicating the presence of multiple species in the solution.
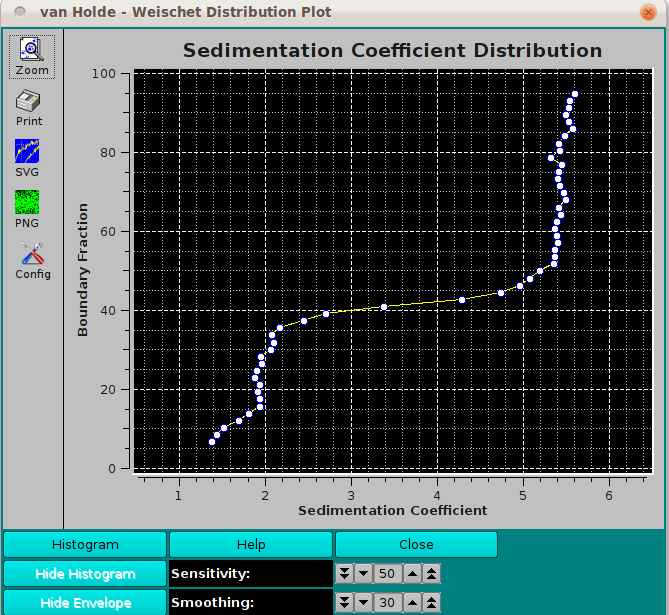
This is the distribution plot option. It is plotted as the boundary fraction as a function of the sedimentation coefficient. In this particular plot, we see ~15% of our species at ~2S, and ~45% at ~5.2S.
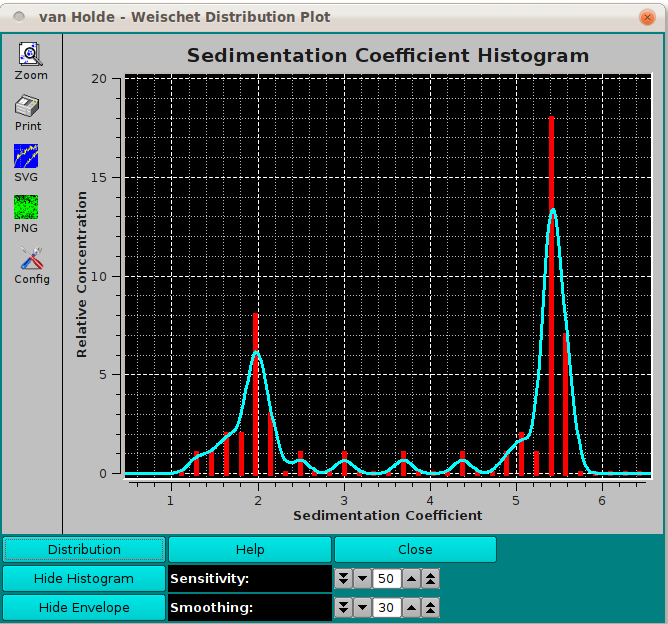
This is the histogram plot option. It is plotted as the relative concentration as a function of the sedimentation coefficient. Again, we see the same data as in the distribution plot.
\(\textbf{Sensitivity}\) Change the sensitivity factor up or down to affect the nature of the histogram.
\(\textbf{Smoothing}\) Change the smoothing factor up or down to affect the nature of the envelope.
\(\textbf{Select Groups}\) Click on this utton to begin a session of choosing vHW Extrapolatino Plot division groups. Multiple groups can be chosen, with division line overlap between groups.
\(\textbf{Use FE Data}\)
\(\textbf{Plateaus from 2DSA}\) Check this box to have plateau values calculated from a model associated with any loaded noise values. If this box is unchecked, each scan's plateau value is determined by a series of fits to initally designated plateaus.
\(\textbf{Manual-only Replot}\) Check this box to supress automatic re-plotting with each parameter change.
\(\textbf{Use Enhanced vHW}\)
ANALYSIS CONTROLS
\(\textbf{Back Diffusion Tolerance}\) Select a tolerance value to fine tune exclusion of points affected by back diffusion.
\(\textbf{Divisions}\) Choose the number of divisions to use in vHW analysis.
\(\textbf{Data Smoothing}\) Choose the number of points to use for any smoothing of raw input data.
\(\textbf{% of Boundary}\) Choose the percentage of the range from concentration baseline to plateau that is used for analysis.
\(\textbf{Boundary Position (%)}\) Choose the percent of the plateau-baseline range that is to be added to the baseline to form the beginning of the analysis span.